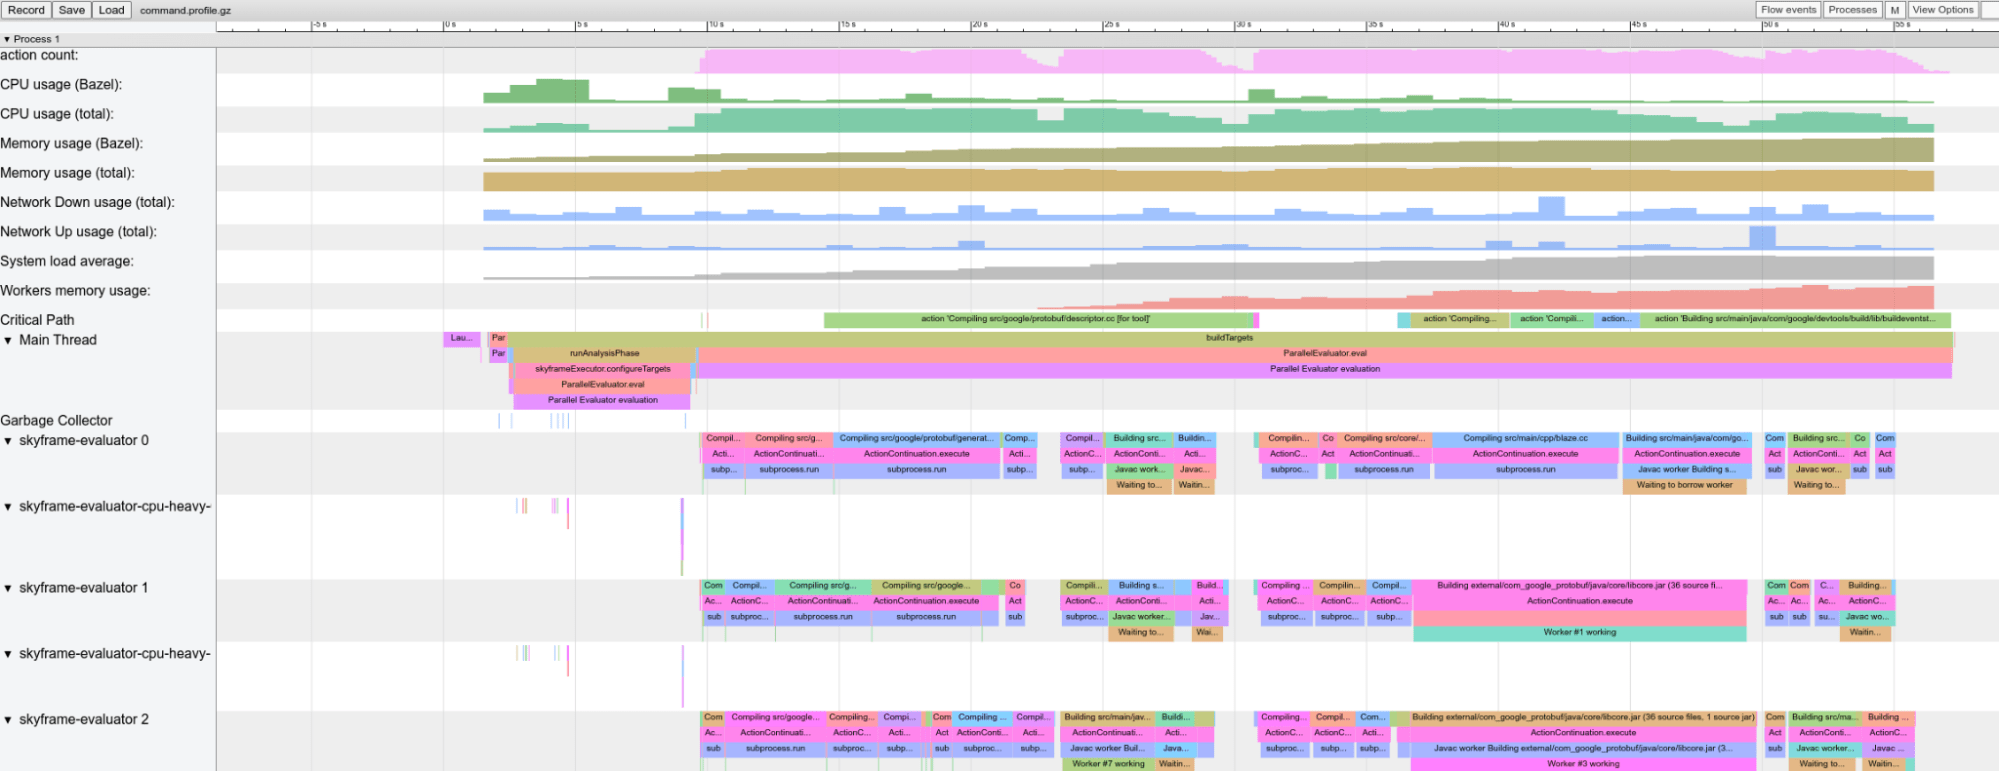
The JSON trace profile can be very useful to quickly understand what Bazel spent time on during the invocation.
By default, for all build-like commands and query, Bazel writes a profile into
the output base named command-$INVOCATION_ID.profile.gz, where
$INVOCATION_ID is the invocation identifier of the command. Bazel also creates
a symlink called command.profile.gz in the output base that points the profile
of the latest command. You can configure whether a profile is written with the
--generate_json_trace_profile
flag, and the location it is written to with the
--profile flag. Locations ending with .gz are
compressed with GZIP. Bazel keeps the last 5 profiles, configurable by
--profiles_to_retain,
in the output base by default for post-build analysis. Explicitly passing a
profile path with --profile disables automatic garbage collection.
Tools
You can load this profile into chrome://tracing or analyze and
post-process it with other tools.
chrome://tracing
To visualize the profile, open chrome://tracing in a Chrome browser tab,
click "Load" and pick the (potentially compressed) profile file. For more
detailed results, click the boxes in the lower left corner.
Example profile:

Figure 1. Example profile.
You can use these keyboard controls to navigate:
- Press
1for "select" mode. In this mode, you can select particular boxes to inspect the event details (see lower left corner). Select multiple events to get a summary and aggregated statistics. - Press
2for "pan" mode. Then drag the mouse to move the view. You can also usea/dto move left/right. - Press
3for "zoom" mode. Then drag the mouse to zoom. You can also usew/sto zoom in/out. - Press
4for "timing" mode where you can measure the distance between two events. - Press
?to learn about all controls.
Bazel Invocation Analyzer
The open-source Bazel Invocation Analyzer consumes a profile format and prints suggestions on how to improve the build’s performance. This analysis can be performed using its CLI or on https://analyzer.engflow.com.
jq
jq is like sed for JSON data. An example usage of jq to extract all
durations of the sandbox creation step in local action execution:
$ zcat $(../bazel-6.0.0rc1-linux-x86_64 info output_base)/command.profile.gz | jq '.traceEvents | .[] | select(.name == "sandbox.createFileSystem") | .dur'
6378
7247
11850
13756
6555
7445
8487
15520
[...]
Profile information
The profile contains multiple rows. Usually the bulk of rows represent Bazel threads and their corresponding events, but some special rows are also included.
The special rows included depend on the version of Bazel invoked when the profile was created, and may be customized by different flags.
Figure 1 shows a profile created with Bazel v5.3.1 and includes these rows:
action count: Displays how many concurrent actions were in flight. Click on it to see the actual value. Should go up to the value of--jobsin clean builds.CPU usage (Bazel): For each second of the build, displays the amount of CPU that was used by Bazel (a value of 1 equals one core being 100% busy).Critical Path: Displays one block for each action on the critical path.Main Thread: Bazel’s main thread. Useful to get a high-level picture of what Bazel is doing, for example "Launch Blaze", "evaluateTargetPatterns", and "runAnalysisPhase".Garbage Collector: Displays minor and major Garbage Collection (GC) pauses.
Common performance issues
When analyzing performance profiles, look for:
- Slower than expected analysis phase (
runAnalysisPhase), especially on incremental builds. This can be a sign of a poor rule implementation, for example one that flattens depsets. Package loading can be slow by an excessive amount of targets, complex macros or recursive globs. - Individual slow actions, especially those on the critical path. It might be
possible to split large actions into multiple smaller actions or reduce the
set of (transitive) dependencies to speed them up. Also check for an unusual
high non-
PROCESS_TIME(such asREMOTE_SETUPorFETCH). - Bottlenecks, that is a small number of threads is busy while all others are idling / waiting for the result (see around 22s and 29s in Figure 1). Optimizing this will most likely require touching the rule implementations or Bazel itself to introduce more parallelism. This can also happen when there is an unusual amount of GC.
Profile file format
The top-level object contains metadata (otherData) and the actual tracing data
(traceEvents). The metadata contains extra info, for example the invocation ID
and date of the Bazel invocation.
Example:
{
  "otherData": {
    "build_id": "101bff9a-7243-4c1a-8503-9dc6ae4c3b05",
    "date": "Wed Oct 26 08:22:35 CEST 2022",
    "profile_finish_ts": "1677666095162000",
    "output_base": "/usr/local/google/_bazel_johndoe/573d4be77eaa72b91a3dfaa497bf8cd0"
  },
  "traceEvents": [
    {"name":"thread_name","ph":"M","pid":1,"tid":0,"args":{"name":"Critical Path"}},
    ...
    {"cat":"build phase marker","name":"Launch Blaze","ph":"X","ts":-1306000,"dur":1306000,"pid":1,"tid":21},
    ...
    {"cat":"package creation","name":"foo","ph":"X","ts":2685358,"dur":784,"pid":1,"tid":246},
    ...
    {"name":"thread_name","ph":"M","pid":1,"tid":11,"args":{"name":"Garbage Collector"}},
    {"cat":"gc notification","name":"minor GC","ph":"X","ts":825986,"dur":11000,"pid":1,"tid":11},
    ...
    {"cat":"action processing","name":"Compiling foo/bar.c","ph":"X","ts":54413389,"dur":357594,"pid":1,"args":{"mnemonic":"CppCompile"},"tid":341},
 ]
}
Timestamps (ts) and durations (dur) in the trace events are given in
microseconds. The category (cat) is one of enum values of ProfilerTask.
Note that some events are merged together if they are very short and close to
each other; pass
--noslim_profile
if you would like to prevent event merging.
See also the Chrome Trace Event Format Specification.
